

Cell production rates in human tissues and tumours and their significance. Part 1 - 19 Downloads
Cell production rates in human tissues and tumours and their significance. Part 1: an introduction to the techniques of measurement and their limitations
-
- Rew* and G. D. Wilson†
*Honorary Senior Lecturer in Surgical Oncology, Southampton University Hospitals, UK and
†The Gray Laboratory, Northwood, Middlesex, HA6 2JR, UK
In the past two decades, the technology of laser cytometry and use of the halogenated thymidine (HP) analogues bromodeoxyuridine and iododeoxyuridine as proliferation labels, have allowed us to quantify the rate of cell turnover in tissues and tumours, in clinical samples as in laboratory models. The principal studies have used injection of bromo- or iododeoxyuridine to measure cell production rates in vivo. Flow cytometry (FCM) has been used to estimate the S phase labelling index (LI) and the S phase duration (Ts) and calculate the cell production rate, represented by the potential doubling time (Tpot). This has allowed calculation of time-dependent indices of proliferation from single biopsies of HP pulse labelled human tissues and tumours. In the first part of this two-part review, we describe the technique and its limitations as a biological assay. The second part summarizes the knowledge gained about cell production rates and the relevance that this information may have to future investigative, prognostic and treatment strategies.
Key words: cell proliferation; flow cytometry; prognosis; clinical outcome; bromodeoxyuridine; cancer.
© 2000 Harcourt Publishers Ltd
Introduction
Cell proliferation provides continuity to life. Knowledge of the rate at which cells proliferate in normal tissues and tumours adds to our understanding of biological processes from embryogenesis to tumourigenesis, and may help in prognostication and in the formulation of antiproliferative strategies in cancer therapy. This two-part review considers critically the progress made in our understanding of cell production rates in clinical tissues and tumours using modern cytometric techniques. In the first part, we describe the cytometric techniques used to measure cell production rates and consider the important constraints upon their interpretation. In the second part, we present the clinical data and review its applications.
The cell cycle concept¹ is the key to understanding cell proliferation rates. ‘Cell kinetics’ is a general term used to encompass measurements which relate to the proliferating compartment.²,³ All tissues and tumours comprise a complex mixture of cell types, including those which are terminally differentiated and non-proliferating. Those cells which retain proliferative potential may either be actively transiting the cell cycle, or quiescent. In the latter case, they may become proliferative in response to a variety of stimuli, including radiotherapy and chemotherapy. The key to the cell cycle is the DNA synthesis, or S phase, during which chromosomes are duplicated, and which is most susceptible to disruption by therapeutic interventions. Cell proliferation measurements in any one tissue or tumour are thus influenced by its growth fraction (GF). This is the proportion of cells capable of active proliferation in the total cell population, of expressing proliferation related markers, and capable of traversing the cell cycle. In most cell populations the GF is much less than 100%, because of the large number of quiescent, differentiated and dying cells, even within rapidly proliferating tumours. Conversely, the growth fraction is usually much larger than the labelling index. This is because many proliferation-capable cells will be at different phases of their individual cycles, or in non-cycling quiescence, at any time point of measurement. This is known as asynchrony. Even in exponentially growing cultures,
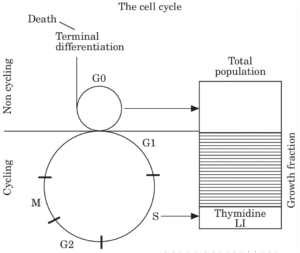
Fig. 1. This illustrates the concept of the cell cycle and the growth fraction.
many capable cells will not be actively cycling at any one time. All capable tissues thus retain a substantial reserve capacity for proliferation under appropriate conditions and stimuli. An understanding of tissue population dynamics is thus governed both by knowledge of the speed of cycling of individual cells, commonly of the order of 30 hours, and the more complex dynamics of the entire population of cells. These concepts are illustrated in Fig. 1.
Why measure cell production rates?
There are a number of reasons to study cell production rates in human tissues and tumours. Core biological research opens new horizons on the behaviour of tissues. Cell proliferation measurements indicate the high rate of cell production in human tissues and tumours, and indicate the importance of cell loss processes in their growth, regression and steady states. Cell production rates might also determine the time needed to reach critical and fatal tumour mass, and thus have a role as indices of prognosis. Such expectations are overly simplistic, because such measures are an inadequate index of biological aggressiveness, because of the importance of cell loss and apoptosis in tumour biology, and because cell production rates may be little different between tumours and normal tissues, such that accelerated growth is not in fact a critical feature of tumour biology. These studies have nevertheless advanced our understanding of the growth of human tissues and tumours.
Cell production rates may also determine the response of tissues and tumours to radiotherapy. Sublethally irradiated tissues are characterized by repair, repopulation and regeneration, particularly of radioresistant clones. By increasing the frequency of fractionated therapy, it is hypothesized that more tumour cells might be irreparably damaged during their proliferative phases, allowing less time for repair and creating a greater fractional cell kill. More rapidly proliferating tumours by cytometric measures might thus be expected to require more rapid fractionation than is conventionally used. For example, a rapidly proliferating tumour with a median cell cycle time of 30 hours might pass through two doubling times over a weekend of treatment lapse.
Cell production rate measurements might similarly be hypothesized to predict the response of tissues and tumours to cytotoxic chemotherapy. Cytotoxic drugs are believed to work at specific phases of the cell cycle. Blockade of an immediately proliferating population will bring other cells into cycle, including drug resistant cells, thus paradoxically increasing the growth fraction and aggressive capacity of the tumour. More frequent dosage, or combinations of drugs acting on different phases or subpopulations, may thus increase the tumour cell kill.
Both radiotherapy and chemotherapy are restricted in practice by their effects on normal tissues, which may be severe. A knowledge of the proliferative capacity of normal tissues is thus important in establishing a safe therapeutic index in respect of adjacent tissues and bone marrow, for the various treatment strategies planned.
The cell cycle and cell proliferation indices
The differential expression of many proteins through the cell cycle, the specific uptake of DNA precursors in the S phase (usually a thymidine analogue), and the asynchronous nature of all spontaneously cycling populations, determine that no cell population will express a cell cycle specific marker in 100% of cells, even if all cells are capable of doing so in the fullness of time. The usual presentation of proliferation marker data is the labelling index (LI), which is the proportion of cells labelled by the study marker in the total measured population. The LI is one example of a static, time-independent index measured at any one time point. Static indices are the most commonly reported measures of cell proliferation data. They include the mitotic index by counting mitoses in tissue sections; the S phase fraction derived from flow cytometric DNA profiles;4–7 and a variety of intrinsic antigens or proteins such as proliferating cell nuclear antigen (PCNA), Ki67, or one of the cyclins.8–11 They are usually detected by monoclonal antibody labels and secondary stains.
The limitations of endogenous proliferation markers
Static indices take a snapshot of the number of labelled cells in a tissue sample at one time point. They give no direct indication of the rate of turnover or transit of the labelled cells in the population, which in turn determines the overall rate of growth of the tissue or tumour. Endogenous protein markers such as Ki67 and PCNA are usually ‘soft indices’, in that their expression is rarely confined to a specific cell cycle phase, owing to time delays in synthesis and degradation, and in that the antigenic epitopes are often labile. They thus usually measure a compartment somewhere between the S phase and the growth fraction, but with considerable imprecision according to epitope preservation, fixation conditions and antibody affinity, for

Fig 2a and 2b. These paired histograms and dot plots display the DNA profiles and corresponding multivariate BrdUrd (Y axis) vs DNA (X axis) analyses of a series of tumours pulse labelled with 250 mg BrdUrd in vivo (see text). All analyses were undertaken on an Ortho cytofluorograph cytometer. The ploidy profile is on the left, and the corresponding BrdUrd vs DNA profile on the right. The two profiles in Figure 2a illustrate diploid breast carcinomas. The profiles in Figure 2b illustrate a typical aneuploid breast carcinoma (upper) and its nodal metastasis (lower).
example. A robust, exogenous S phase marker is thus preferable for S phase labelling studies.
DNA content/Ploidy analysis
Certain organic dyes, which include propidium iodide, ethidium bromide, acridine orange and 7-aminoactinomycin bind to DNA stoichiometrically, that is in proportion to the quantity present in each nucleus. This allows the generation of a DNA profile, which is a histogram of DNA content in the population of cells or nuclei. DNA content, being proportional to the light intensity emitted by its marker dye, is conventionally plotted linearly on the X axis.
The DNA histogram forms one of two patterns. A diploid tumour displays a large narrow primary peak corresponding to cells in the G0/G1 phase of the cell cycle (diploid chromosome content), and a smaller peak corresponding to cells in the G2 phase of the cell cycle (tetraploid chromosome content). The intermediate zone corresponds to S phase cells (Fig. 2a). The DNA content in G0/G1 can be defined in relation to a reference standard such as nucleated chicken erythrocytes. Elements to the left of the G0/G1 peak were once thought to comprise cell and nuclear fragment debris, but are now recognized to contain both hypodiploid (subdiploid) cells and the important apoptosing fraction in some instances.
Aneuploid tumours usually comprise one additional tumour stem line with abnormally increased DNA content, interwoven with a diploid population, which in turn comprises a mix of stromal cells (e.g. lymphocytes) and diploid tumour cells. The DNA profile of the aneuploid cells (G1-S-G2) is in effect superimposed on the diploid DNA profile but shifted along the X axis to the right (denoting greater DNA content) according to the excess DNA present in the aneuploid cells. Occasionally, multiple aneuploid populations of tumour cells are present, each with their own distinguishable G0/G1 and G2 peaks (Fig. 2b).
DNA analysis is a remarkably reproducible technique, which has been widely applied to retrospective and prospective series of clinico-pathological material from all classes of human tumour, in respect of prognostic and clinical outcome measures. It is not the purpose of this paper to further review the clinical literature on DNA analysis. However, it poses interpretational problems which are often underestimated, and which have a bearing on data presented in the second part of this educational review.
FCM analysis depends upon the preparation of single cell or nuclear suspensions from solid tumours by enzymatic or mechanical means, either from fresh, unfixed tumours and tissues which are variably resistant to disaggregation according to their stromal content, or extracts of nuclei from archival material from formalin-fixed, wax-embedded blocks. In the latter case, whole cell extraction is impractical. Disaggregation may cause considerable antigen loss and subcellular fragmentation. Extraction artefact may lead to rejection rates or failure of analysis in up to 40% of samples in reputable series.
The analytical problem of aneuploidy
Flow cytometry cannot distinguish nuclei of tumour cells from stromal cells in diploid populations, thus confounding the interpretation of ploidy profiles. The complexity of aneuploid profiles causes greater difficulties in interpretation. Each profile may be deconvoluted
mathematically into the various peaks and cell cycle phase specific segments of the constituent diploid and aneuploid populations (Figs 3a, 3b). This is an imprecise estimation, particularly where peaks lie close together or overlap, such as in near diploid or tetraploid tumours.
The S phase fraction (SPF)
The SPF is a derivative measure of the ploidy profile when studied by flow cytometry. It is often presented as a surrogate measure of proliferation, but in fact is one of the least reliable measures for a number of reasons. In diploid profiles, the S phase represents a small proportion (often less than 10%) of the total population, and in turn is composed of the proliferating populations of tumour and stromal nuclei, which cannot effectively be separated within the profiles. More importantly, there is no clear distinction between the boundaries of the G0/G1, S and G2/M phases, but a merging at the margins of their distributions. The imprecision of overlap, particularly at the S–G2/M boundary, obliges guesswork and a variety of deconvolution algorithms, small errors in which can have a disproportionate effect on the calculated SPF and the subsequent classification of a tumour.
This problem is much worse in the aneuploid tumours which comprise up to 75% of most solid tumour series. The overlap of diploid and aneuploid populations renders deconvolution little more than guesswork, as a large aneuploid G0/G1 peak often overlies the small diploid S phase, a problem reciprocated by the overlap of the diploid G2/M peak on the aneuploid S phase. Stratified studies of flow cytometric SPF measures and outcome or prognosis must thus be treated with the greatest caution, however well controlled, because of this fundamental physical problem. Robust SPF markers are thus needed which are independent of the DNA profile.
The time component in cell proliferation
True proliferation measurements need a time component. We may describe these measurements colloquially as ‘dynamic’ indices to distinguish them from ‘static’ indices which lack a time element. Such measurements include the S phase duration (Ts) and the cell cycle time (Tc) of cells; and the potential doubling time (Tpot) and volume doubling time (Vd) of the tumour. In an exponentially growing population where all cells are in cycle and there is no cell loss, the tumour doubling time is the cell cycle time. The Tpot is the time taken for cell numbers to double in a population where GF is less than unity and in the absence of cell loss, which is the usual situation. The Vd is the observed tumour growth rate, usually much slower in clinical tumours because of the large contribution of the cell loss factor.
There are a number of techniques reported for the measurement of time-dependent indices (Table 1). The stathmokinetics and the fraction of labelled mitoses methods^5 are now little used and are of historical interest, having been superseded by flow and laser scanning cytometry techniques which are the mainstay of this review. Histometric double labelling techniques with the non-radioactive halogenated pyrimidines (HPs), bromodeoxyuridine (BrdUrd), and iododeoxyuridine (IdUrd) using stathmokinetic principles find little practical application.^6 We will also present the argument that the S phase duration may be a species specific constant within the limits of experimental error, in which case the use of in vitro measures of labelling indices may suffice as surrogates for in vivo, time-dependent measures of proliferation. The in vivo present greater technical and resource demands and require ethical committee approval and informed consent, which adds to the administrative burden of in vivo studies.
Tritiated thymidine labelling
The thymidine analogues are ideal markers of dynamic proliferation. Cells incorporate endogenous and exogenous
thymidine and its analogues into DNA during the S (DNA synthesis) phase of the cell cycle. From 1950 to the early 1980s, tritiated thymidine, 3H-TdR, was the principal tool for cell cycle studies and for measurements of the S phase compartment and of cell production rates.12–15 The fraction of labelled mitoses (FLM) method allowed the cell cycle time to be determined from the rate of accumulation of radiolabelled mitoses from serial biopsies. The rate of change in the number of labelled mitotic cells with time provides the cell production rate. Whilst a useful tool in animal and cell line models, the technique is extremely slow and labourious, attendant as it is upon the development of autoradiographic plates and manual counting. Film requires several weeks for development. The technique requires multiple sequential biopsies to be taken from the tumour or tissue. These factors severely limit its applications in clinical practice.
Halogenated pyrimidine labelling
The non-radioactive halogenated pyrimidines (HPs) bromodeoxyuridine (BrdUrd)16 and iododeoxyuridine (IdUrd)17, have transformed the study of cell production rates in tissues and tumours in vivo. The HPs are synthetic, non-radioactive deoxyuridine analogues which are also rapidly and consistently incorporated into the DNA during the S phase of the cell cycle in living tissues. The halogen moiety can be detected with DNA by monoclonal antibodies and by histochemical markers. In the early 1980s, a number of monoclonal antibodies were developed for the specific detection of these analogues when incorporated into either single stranded (SS) or double stranded (DS) DNA.18–22 The HP binding monoclonal antibodies can in turn be detected in one of two ways; by immunochemistry of labelled tissue sections,16,23,24 or using fluorescent dyes such as Fluorescein to tag the antibodies for analysis in a laser cytometer.
Halogenated pyrimidine labelling and tissue architecture
The need to disaggregate tumours and tissues into suspensions for laser cytometric analysis destroys many dimensions of data inherent in the tissue architecture. The histological study of tissues labelled with HPs provides a powerful descriptive tool in its own right, and circumvents this problem for semiquantitative studies. S phase cells labelled by either in vitro or in vivo techniques can be clearly distinguished by conventional immunohistochemical techniques. This allows clear identification of proliferating cells and regions within tissues and tumours, as illustrated in Figs 4a and 4b.
Quantitative studies of the HP labelling index by conventional counting of labelled tumour sections can be integrated with flow cytometrically derived Ts values to estimate the rate of proliferation of various sub-regions within a tissue section. This is illustrated in Fig. 5.
Halogenated pyrimidine labelling and laser cytometry
Cells labelled with fluorochromes can be quantified by computer controlled cytometry instruments in rapid, automated assays. Flow cytometry (FCM) has been the mainstay of such research for two decades. Flow cytometry works through the illumination of a stream of isolated cells or cell nuclei in suspension with a light beam of known wavelength, usually from a laser source. Scattered or transmitted light is collected by a series of photomultiplier tubes, such that cell size and granularity can be deduced. If the cells or nuclei are marked with fluorescent dyes, other characteristics can be measured simultaneously. Typically, 5–10 000 cells or nuclei can be analysed in a few minutes from any one tumour biopsy. For each cell or nucleus, the computer assimilates data from each of its light collectors and presents it to the observer as scatter plots or histograms. A fluorescent event is allocated to one of 1024 channels of fluorescence according to its light intensity.
Multiparameter cytometric assays
The capacity of conventional FCM instruments to measure up to six simultaneous parameters per cell allows the rapid and accurate quantitation of two or more fluorochrome tagged biomarkers in large, heterogeneous cell populations. If one parameter is the DNA profile, the cell cycle distribution of any other protein or antigen for which a monoclonal antibody is available may be studied in many thousands of cells.25–28 Laser scanning cytometry is a new technology which can perform similar analyses, but with the advantage of direct visualization and recall of the sample under study.29,30 This multiparameter capability of laser cytometry underpins much of the work reviewed here. We will focus on dual parameter analysis (DNA profile and one proliferation marker), but up to five parameters can be measured simultaneously in clinical immuno-phenotyping and leukocyte differentiation.
Fig. 4 These photomicrographs are of colorectal mucosa (a) and a well differentiated adenocarcinoma (b) obtained at surgery, where the BrdUrd pulse labelled proliferating cells are detected immunohistochemically (see text) with peroxidase counterstain. They illustrate the clarity with which S phase labelled cells and their distribution can be identified by conventional staining and microscopy.
Halogenated pyrimidine data from clinical studies
HPs can be used in one of three ways to obtain data on the proliferating compartment: by in-vitro incubation of freshly obtained tumour samples; by in-vivo infusion over a period of hours to saturate the replicating fraction of cells; or by in-vivo, intravenous pulse labelling pre-operatively to obtain dynamic indices. HP markers are remarkably robust within tumour biopsies and resected surgical specimens, surviving long-term storage of tissue samples in ethanol and formalin fixation, and degradation during mechanical and enzymatic extraction. The HP labels also survive the caustic acid denaturation required to unravel DNA to permit antibody access. Moreover, an HP label can only be used once in one clinical sequence because it remains detectable in the cells for several cell generations in vivo, being transmitted (and progressively diluted) with each succeeding cell division.
The clinical safety of the halogenated pyrimidines
The safety of HPs in research use is an important issue. Their incorporation into DNA raises concerns about mutagenicity. In experimental cell systems, ultraviolet light increases the damage to DNA containing BrdUrd in tumour cells in culture.52-57 It also inhibits cell differentiation in animal models. Findings from these experimental models must be interpreted with caution, as the unusual experimental conditions of the animal or cell model may not translate to the human body. For example, a DNA
Fig. 5. This illustrates the problem of heterogeneity of potential doubling time calculations according to the method of estimation of the labelling index in a series of 60 human colorectal tumours: FCM: flow cytometric method; Average, average counts from histochemically labelled sections; Max: the counts from maximally proliferative zones on the tissue sections (see text). □: FCM; ○: Average; Δ: Maximum.
strand break assay may not take into account damage reversal by the DNA repair enzymes and topoisomerases which regulate the integrity of mammalian chromosomes.
The HPs were originally developed for clinical use as a tumour radiosensitiser in the 1950s, to be given as an adjunct to radiotherapy by intravenous injection in doses of 1 g per day for up to 40 days.33,34 Both agents continue to be used for radiosensitization of tumours of the brain, and for the delivery of therapeutic doses of radioiodine to lesions such as liver metastases. Some toxicity has been reported with HPs in the role of high dose radiosensitizers, such as photosensitization. For example, Fine and Breathnach35 reported two cases of cutaneous papular eruptions in patients with brain tumours treated with high dose BrdUrd and radiotherapy.
Concerns about the long-term mutagenicity of the analogues must also be tempered by the fact of their use at low and single doses in patients with established neoplasia, and in proportion to the risk of genotoxicity of conventional chemotherapy or radiotherapy during the course of treatment, and because no untoward acute or long-term effects have come to light in studies of more than 2500 patients to date.
In-vitro studies of HP labelling
Incubation of freshly harvested and viable tissue and tumour cells with HPs in the laboratory can be used in conjunction with immunohistochemical or flow cytometric detection to obtain a static measure of the HP labelling index (LI). It can be performed in the laboratory without the need for in-vivo injection or clinical consent, and has been used by many groups over a wide range of tumour and tissue types.16
These include lung, breast and other tumours,35 gastric adenomas and gastric cancers,37,38 and transitional cell carcinoma of the bladder.39 The comparability between the thymidine analogue labelling index of tissues which have been incubated in vitro with BrdUrd or 3H-Thy has been established in studies of human breast tumours40,41 and human colorectal and cervical tumours.42
In-vivo studies of HP labelling by continuous infusion
In-vivo labelling offers advantages over in-vitro techniques. When given intravenously (or intraperitoneally in animal models), the label is delivered physiologically to the tumour mass. Over short infusion periods immediately prior to, or at the time of biopsy, the labelled fraction will consist almost entirely of those which are in the S phase, and a few which have passed into G2/M. The administration of a HP by continuous i.v. infusion over several hours progressively saturates cycling cells with label, such that as more and more cells enter and pass through and out of the S phase, so the labelled fraction approaches the growth fraction. Continuous or peri-biopsy infusion denies the option of time-dependent data provided by a pulse label given a few hours earlier, but has nevertheless been a widely adopted technique to measure the HP labelling index, or S phase fraction.
Such studies of in-vivo HP labelling of human tumours to derive static indices were reported in the early 1980s.40–44 Since then, many series of data have been reported on various classes of tumour. These include intracranial gliomas,45 bronchial tumours,46 meningiomas,47 transitional cell carcinoma of the bladder,48 renal carcinomas,49 squamous cell carcinomas (SCC) of head and neck50 and breast tumours.51–53
Development of proliferation dynamics by HP pulse labelling in vivo
In an important conceptual advance, Begg and colleagues reported in 1985 54 how a single pulse label of bromodeoxyuridine, and flow cytometry, could be used to derive consistent, time-dependent data from a single biopsy of a tumour following in-vivo (intraperitoneal or intravenous) drug administration. Pulse labelling with an interval between labelling and biopsy allows cohorts of HP labelled cells, which were in the S phase at the time of pulse labelling, to be followed through their cycle, which introduces the time element to the analyses. Figure 6 illustrates the principle of dual parameter analysis of a HP labelled cell population.
The movement of cells through the cell cycle over a known time from pulse labelling to biopsy allows the S phase duration (Ts) to be calculated. This is illustrated in Fig. 7. If it is assumed that the pulse label of HP is evenly incorporated into S phase DNA at the time of pulse labelling, and the rate of DNA synthesis is constant, then the median DNA content of the labelled DNA measured along the X axis will increase constantly with time to the G2 value, at which point the labelled cells mitose. Because the interval
Fig. 6. This illustrates the principle of dual parameter flow cytometry. Cells in suspension labelled with propidium iodide (to label DNA) and fluorescein (to detect incorporated bromodeoxyuridine). The resulting data is represented as a three-dimensional histogram to show how the various phases of the cell cycle, and labelled and unlabelled cells, can be distinguished (courtesy of Dr Joe Gray, University of California, San Francisco).
between labelling (T0) and biopsy (Tx, for example 3 hours) is known, this allows the Ts to be calculated by simple extrapolation. The computer will readily make these calculations from analytical templates of the relevant populations of labelled and unlabelled cells in each cell cycle phase in diploid and aneuploid tumours.
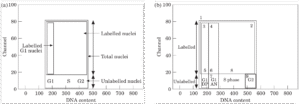
The elegance and validity of this model is illustrated in
Fig. 7. This Figure illustrates the principle of Ts calculation. In (a), the labelled population of cells is represented by the hatched bars. The S phase duration is calculated by extrapolation from the known time interval between injection and biopsy. (b) presents this principle in another way, demonstrating the relationship between the labelled population movement on the flow cytometric histogram and within the cell cycle.
Fig. 8. This illustrates a study of BrdUrd incorporation after bolus intraperitoneal injection into the human HT29 colorectal tumour grown in a mouse model. The G0/G1 phase of the principal tumour cell population is centred on channel 40 on the X axis, BrdUrd fluorescence is represented on the Y axis. By 2 hours, labelled S phase cells are seen in the G2M phase. The labelled S phase population between co-ordinates 40–70 on the X axis and 10–100 on the Y axis, moves steadily to the right as the cell cycle proceeds. By 10 hours, many labelled cells have appeared in G0/G1 of the daughter cell cycle. Such serial sampling is rarely possible in clinical practice.
The Ts estimation and the HP labelling index thus allow the Tpot to be calculated from one time point analysis of a single biopsy. The Tpot is related to the Ts by the equation
, where lambda is a correction factor for the distribution of cell age in the study population, usually taken to be between 0.6 and 0.8.
There appears to be high concordance when the Ts and Tpot are calculated by the 3H-TdR and BrdUrd/FCM techniques in experimental models.^25 It is remarkable that the injected HP molecules avoid metabolism, sequestration and dilution, to achieve delivery to the tumour mass, transport into proliferating cells and rapid incorporation into replicating S phase DNA within an hour of injection.
In preliminary clinical studies, the incorporation of BrdUrd was shown to be reliable, reproducible and measurable when the analogue was given as the analogue intravenously in small, subclinical doses of 100–250 mg as a single intravenous bolus within 24 hours of surgical biopsy. Wilson et al. in 1985^85 reported the in vivo measurement of the LI, Ts and Tpot of 26 evaluable human tumours of
Fig. 8. This series of experiments illustrate the principle of cell cycle progression with time highlighted by BrdUrd incorporation into a human tumour. The study shows BrdUrd incorporation into the human HT29 colorectal tumour grown in a mouse model after bolus intraperitoneal injection. The G0/G1 phase of the principal tumour cell population is centred on channel 40 on the X axis. BrdUrd fluorescence is represented on the Y axis. By 2 hours, labelled S phase cells are seen in the G2M phase. Labelled cells continue to move through the cell cycle, such that by 10 hours, many labelled cells have appeared in G0/G1 of the daughter cell cycle (see text).
various lineages obtained by local biopsy. Riccardi et al. in 1985^86 reported the in-vivo cell kinetics of 45 acute leukemias, 27 gastric carcinomas and 16 gliomas. These validated the technique in clinical practice and established its further use.^87–89
Constraints to the interpretation of dynamic proliferation measurements
There are both biological and technical factors which affect the interpretation of dynamic proliferation data. These are outlined in Table 2.
Biological factors
Proliferation data cannot provide a complete or predictive assay of the biological behaviour of clinical tumours, because they do not describe the properties of invasion and metastasis which usually determine biological aggressiveness and clinical outcome. Proliferative measurements are usually made on the primary tumour, and these may have little relevance to the proliferative biology of metastatic or invasive clones.
Solid tumour heterogeneity of architecture and cell distribution confounds the interpretation of many data in clinical oncology.^90 Intratumour heterogeneity and site-to-site variation for proliferation parameters is significant, as would be expected for tumours which display architectures which range from the vital to the necrotic. The problem posed by intratumour heterogeneity of labelling is compounded by the technique selected for measurement of the HP labelling index. HP labelling yields a range of indices of proliferation within any one tumour. Histochemical measures of the labelling index derived by manual counting are usually higher than equivalent FCM-derived indices.^91,92 This is in part because observers focus on highly labelled areas of the slide and tend to exclude stromal cells from the count.
Because labelling varies considerably from site to site within a tumour, we are also presented with a complex problem in deciding which of the many indices generated from one reliable phase marker is most representative of the proliferation of the tumour. The LI(max) and Tpot(max), determined from counting the maximally proliferative areas of the tissue section, may be appropriate because these regions are likely to have the greatest bearing on tumour behaviour. Thus, even if a careful assessment of heterogeneity is made in multiple biopsies, the data may
not be a true measure of cell production throughout the tumour.^2 The problem of heterogeneity of proliferation parameters is highlighted in Fig. 5. In this study, we have calculated the Tpot by the method of Begg for 60 colorectal tumours from our series using the same Ts values but with labelling index data derived in one of three ways, each of which is entirely legitimate: by flow cytometry; by using average counts from histochemically labelled sections; and by counting the maximally proliferative zones on the tissue sections. The series displays upwards of two-fold variation in estimated proliferation rates depending upon the LI counting method chosen.
Changes in proliferative biology with time also confound interpretation of proliferation data. Tumour growth fractions and proliferation rates may change with growth and time. A snapshot biopsy measurement taken at any point in the life of the tumour may not be predictive either of the past behaviour or of future growth characteristics of that tumour.
The cell loss factor has a major bearing on the clinical volume growth of a tumour. Tissue and tumour growth is a dynamic disequilibrium between cell production and cell loss. Proliferation measurements do not take into account tumour and tissue cell loss during growth. There is a substantial disparity between the actual volume growth of tumours as measured directly or by serial radiology and the potential doubling time. Cell loss from tumours is caused by processes which include exfoliation, cell migration or metastasis, necrosis and apoptosis. Thus, a highly proliferative tumour with a high cell loss factor may remain static in size or even regress, while a slowly proliferative tumour with no cell loss will continue to enlarge, as will a tumour whose cells of origin proliferate at exactly the same rate as in the derivative epithelium, but whose cell loss rate is altered, for example through reduced frequency of programmed cell death.
Technical factors in multiparameter assays
The reliability of analysis is a key factor in the interpretation of raw multiparameter proliferation data.^5 The problems of deconvolution of the ploidy profile into constituent cell phases affects the allocation of labelled cells to the correct population, and thus influences the calculation of the S phase duration. This is a particular problem in low labelling tumours. A similar problem arises in determining the cut-off point between labelled and unlabelled cells on the Y axis, where there is usually a gradual transition in the intensity of fluorescence. An arbitrary distinction may need to be made between labelled and unlabelled cells, thus influencing the calculation of the labelling index.
There remain concerns about technical, observer and institutional variability in the data, contributing to the spread of data within and between tumours.^4 The specific characteristics of the individual cytometer may vary, as may preparation protocols, antibody affinities and other experimental factors. The choice of analytical algorithm and the specific training of the individual observer will influence the interpretation of raw cytometric data. Concern has also been expressed about the stoichiometry of antibody binding after DNA denaturation.^5,11 The disaggregation of samples into suspension can cause a damage artefact, while the loss of tissue architecture and the method of analysis prevents validation of the type and relationship of the tumour and stromal cells, and their relative proportions and proliferative activities in the population under study. All these factors must introduce a degree of ‘fuzziness’ into the precision of the assays, and must be taken into account in advance of overly zealous data interpretation.
Nevertheless, dynamic proliferation indices give us a broad and unprecedented insight into the proliferative biology of human tissues and tumours. A large number of clinical tumours of many classes have now been studied for purposes of core research, prognosis and therapy. In part II, we will review published and unpublished data on human tumour proliferation derived from the halogenated pyrimidine assay, and its various clinical applications.
Acknowledgements
We thank the many surgeons, oncologists and patients who have supported our own studies and collaborations in this
field of clinical research, including Mr P. C. Weaver, Mr M. R. Thompson and Dr V. Svoboda at Portsmouth, and Professor I. Taylor and Mr C. D. Johnson at Southampton between 1988 and 1991. Elements of our work have been supported in turn by the Cancer Research Campaign, Wessex Cancer Trust and the NHS Research and Development Executive in Trent Region.
References
- Howard A, Pelc SR. Nuclear incorporation of 32P as demonstrated by autoradiographs. Exp Cell Res 1951; 2: 178–87.
- Laird AK. Dynamics of tumor growth. Br J Cancer 1964; 18: 490–502.
- Steel GG. Growth kinetics of tumors. Oxford, UK: Clarendon Press, 1977.
- Frankfurt OS, Slokum HK, Rustum YM. Flow cytometric analysis of DNA aneuploidy in primary and metastatic human solid tumours. Cytometry 1984; 5: 71–80.
- Frankfurt OS, Arbuck SG, Chin JL, Greco WR. Prognostic applications of DNA flow cytometry for human solid tumours. Annals NYAS 1986; 486: 276–90.
- Hedley DW. Flow cytometry using paraffin-embedded tissue. Five years on. Cytometry 1989; 10: 229–41.
- Tubiana M, Courdi A. Cell proliferation kinetics in human solid tumours: relation to probability of metastatic dissemination and long term survival. Radiother Oncol 1989; 15: 1–18.
- Quinn CM, Wright NA. Review Article; The clinical assessment of proliferation and growth in human tumours: Evaluation of methods and applications as prognostic variables. J Pathol 1990; 160: 93–102.
- Hall PA, Levison DA, Woods AL, et al. Proliferating cell nuclear antigen localisation in paraffin sections: An index of cell proliferation with evidence of deregulated expression in some neoplasms. J Pathol 1990; 162: 285–94.
- Gerdes J, Schwab U, Lemke H, Stein H. Production of a mouse monoclonal antibody reactive with a human nuclear antigen associated with cell proliferation. Br J Cancer 1983; 31: 13–20.
- Darzynkiewicz Z, Gong J, Juan G, Ardelt B, Traganos F. Cytometry of cyclin proteins. Cytometry 1996; 25: 1–13.
- Taylor JH, Woods PS, Hughes WL. The organization and duplication of chromosomes using tritium-labelled thymidine. Proc Natl Acad Sci USA 1957; 43: 122–8.
- Quastler H, Sherman FG. Cell population kinetics in the intestinal epithelium of the mouse. Exp Cell Res 1959; 17: 420–8.
- Wright NA, Britton DR, Bone G, Appleton DR. Cell proliferation in gastric carcinoma. A stathmokinetic study. Cell Tissue Kinet 1977; 10: 429–38.
- Campling RN. Cell kinetics of colorectal tumours. Recent results Cancer Res 1982; 83: 21–30.
- Dolbeare F. Bromodeoxyuridine as a diagnostic tool in biology and medicine. Part I: Historical perspectives, histochemical methods and cell kinetics [Review]. Histochem J 1995; 27: 339–69.
- Begg AC, Moores L, Holland L, Dessing M, Bartelink H. Human tumour kinetics using a monoclonal antibody against iododeoxyuridine. Intra-tumour labelling variations. Radiother Oncol 1988; 11: 337–47.
- Gratzer HG. Monoclonal antibody to 5-bromo and 5-iodo deoxyuridine: a new reagent for detection of DNA replication. Science 1982; 218: 474–5.
- Gray JW. Monoclonal antibodies against bromodeoxyuridine. Editor. Cytometry 1985; 6: 499–662.
- Vanderlaan M, Thomas CB. Characterization of monoclonal antibodies to bromodeoxyuridine. Cytometry 1985; 6: 501–5.
- Gonchoroff NJ, Greipp PR, Kyle RA, Katzmann JA. A monoclonal antibody reactive with 5-bromo-2-deoxyuridine that does not require DNA denaturation. Cytometry 1985; 6: 506–12.
- Beisker W, Dolbeare F, Gray JW. An improved immunocytochemical procedure for high sensitivity detection of incorporated BrdUrd. Cytometry 1987; 8: 235–9.
- Sasaki K, Ogino T, Takahashi M. Immunohistological determination of labeling index on human tumor tissue sections using monoclonal anti-BrdUrd antibody. Stain Technol 1986; 61: 155–61.
- Nishizaki T, Orita T, Sakai M, Furutani Y, Aoki H. Cell kinetics studies of human brain tumors by in vitro labeling using anti-BrdUrd monoclonal antibody. J Neurosurg 1988; 69: 371–4.
- Dolbeare F, Gratzner H, Pallavicini M, Gray JW. Flow cytometric measurement of total DNA content and incorporated bromodeoxyuridine. Proc Natl Acad Sci USA 1983; 80: 5573–7.
- Dolbeare F, Beisker W, Pallavicini MG, Vanderlaan M, Gray JW. Cyto-chemistry for BrdUrd/DNA analysis. Stoichiometry and sensitivity. Cytometry 1985; 6: 521–30.
- Waldman FM, Dolbeare F, Gray J. Clinical applications of the bromodeoxyuridine/DNA assay. Cytometry 1988; 5 (Suppl. 3): 65–72.
- Kamentzky LA, Kamentzky LD. Microscope based imager analyzer laser scanning cytometer which yields data comparable to flow cytometry data. Cytometry 1991; 12: 381–7.
- Rew DA, Reeve L, Wilson GD. A comparison of flow and laser scanning cytometry in the study of bromodeoxyuridine derived proliferation parameters in human tumors. Cytometry 1998; in press.
- Barret JC, Tsutsui T, Toz POP. Neoplastic transformation induced by a direct perturbation of DNA. Nature 1978; 274: 229–32.
- Kaufman ER. Alkaline CTIP synthetase activity confers resistance to 5-bromodeoxyuridine toxicity and mutagenesis. Mutat Res 1986; 161: 15–27.
- Raffel C, Deen DF, Edwards MS. Bromodeoxyuridine: a comparison of its photosensitizing and radiosensitizing properties. J Neurosurg 1988; 69: 410–15.
- Kinsella TJ, Mitchell JB, Russo A, Aiken M, Morwyn G, Hau SM, Rowland J, Glatstein E. Continuous intravenous infusion of bromodeoxyuridine as a clinical radiosensitizer. J Clin Oncol 1984; 2: 1144–50.
- Speth PA, Kinsella T, Chang A, Klecker R, Belsanger K, Smith R, Rowland J, Cupp J, Collins JM. Iododeoxyuridine incorporation into human hematopoietic cells, normal liver and hepatic metastases in man as a radiosensitizer and as a marker for cell kinetic studies. Int J Radiat Oncol Biol Phys 1989; 16: 1247–50.
- Fine JD, Braathach SM. Distinctive eruption characterised by linear supravenous papules and erythrodema following bromodeoxyuridine therapy and radiotherapy. Arch Dermatol 1986; 122: 199–200.
- Lloveras B, Garin-Chesa P, Myc A, Melamed M. In vitro bromodeoxyuridine labelling of malignant neoplasms. A comparative study with flow cytometry cell-cycle analysis. Am J Clin Pathol 1994; 101: 703–7.
- Miwa H, Wada R, Abe H, Ohkura R, Yang SW, Watanabe H, Ogihara T, Hamada T, Sato N. Diagnosis of gastric adenoma versus early gastric cancer by bromodeoxyuridine immunohistochemistry from gastric biopsy specimen. J Gastroenterol Hepatol 1993; 8: 133–7.
- Kang SM, Kim WH, Kim CW, Kim YI. Comparison of bromodeoxyuridine and proliferating cell nuclear antigen labelling in gastric carcinoma. J Korean Med Sci 1994; 9: 16–20.
- Tachibana M, Miyakawa A, Nakamura K, Baba S, Murai M, Iijima H. Role of proliferative activity estimated by BrdUrd labelling index in determining predictive factors of recurrence in superficial transitionally malignant bladder tumors. Urol 1996; 156: 63–9.
- Meyer JS, Naught J, Koehn S, Hughes J. Cell kinetics of human tumors by in vitro bromodeoxyuridine labeling. J Histochem Cytochem 1989; 37: 1449–54.
- Meyer JS, Koehn SL, Hughes JM, Higa E, Williford JL, Lagos JA, Manes JL. Bromodeoxyuridine labeling for S-phase measurement in breast carcinomas. Cancer 1993; 71: 3531–40.
- Wilson GD, McNally NJ, Dunphy E, Karcher H, Pflugr R.
- Yoshino T, Nagashima T, Murovic J, Lewin E, Lewin V, Rupp S. Cell kinetic studies of in situ human brain tumours using bromodeoxyuridine. Cytometry 1985; 6: 627–33.
- Raza A, Ucar K, Preissler HD. Double labelling and in vitro versus in vivo incorporation of BrdUrd in patients with acute nonlymphocytic leukemia. Cytometry 1985; 6: 633–41.
- Hoshino T, Prados M,Wilson CB, Cho KG, Lee KS, Davis RL. Prognostic implications of the bromodeoxyuridine labelling index of human gliomas. J Neurosurg 1989; 71: 335–41.
- Timmermans MM, Lenders MH, ten Velde GP, Wagenaar SS, Blijham GH, Ramaekers FC, Schutte B. Evaluation of proliferative parameters in vivo BrdUrd labelled lung cancers. Virchows Archiv 1995; 427: 295–301.
- Langford LA, Cooksey CS, DeMonte F. Comparison of MIB-1 (Ki-67) antigen and bromodeoxyuridine proliferation indices in meningiomas. Hum Pathol 1996; 27: 350–4.
- Popert RJ, Joyce AD, Thomas DJ, Wainwiley BH, Copocott MJ. Bromodeoxyuridine labelling of transitional cell carcinoma of the bladder—an index of recurrence? Br J Urol 1993; 71: 279–83.
- Larsson P, Roos G, Stehling R, Ljungberg B. Proliferation of human renal cell carcinoma studied with in vivo iododeoxyuridine labelling and immunohistochemistry. Scand J Urol Nephrol 1994; 28: 135–40.
- Kotchetkov VM, Coon JS, Taylor S, Hutchinson JL, Paine W, Caldarelli DD, LaFollette S, Preisler HD. In vivo labelling with halogenated pyrimidines of squamous cell carcinomas and adjacent non-involved mucosa of head and neck region. Cell Proliferation 1995; 28: 497–509.
- Goodson WH, Ljung BM, Moore DH, Mayall B, Waldman FM, Clewell R, Benze CC, Smith HS. Tumor labelling indices of primary breast cancers and their regional lymph node metastases. Cancer 1993; 71: 3914–19.
- Christov K, Chew KL, Ljung BM, Waldman FM, Goodson WH 3rd, Smith HS, Mayall BH. Cell proliferation in hyperplastic and in situ carcinoma lesions of the breast estimated by in vivo labelling with bromodeoxyuridine. J Cellular Biochem 1994; Suppl. 19: 165–72.
- Maas RA, Bruning PF, Breedijk AJ, Petese JL. Iododeoxyuridine labelling of S-phase fraction in fine needle aspirates from breast carcinomas. J Clin Pathol 1996; 49: 607–9.
- Begg AC, McNally NJ, Shrive DC, Karcher H. A method to measure the duration of DNA synthesis and the potential doubling time from a single sample. Cytometry 1985; 6: 620–6.
- Wilson GD, McNally NJ, Rische S, Saunders MJ, Dea Rochers C, Lewis AA, Bennett MH. Measurement of cell kinetics in human tumours in vivo using bromodeoxy-uridine incorporation and flow cytometry. Br J Cancer 1988; 58: 423–31.
- Riccardi AI, Dano M, Wilson GD, Ucci G, Dorre P, Mazzini G, Brugnatelli S, Grino M, McNally N, Ascari R. Cell kinetics in human malignancies studied with in vivo administration of bromodeoxyuridine and flow cytometry. Cancer Res 1988; 48: 6238–45.
- Begg AC. Derivation of cell kinetic parameters from human tumours after labelling with bromodeoxyuridine or iododeoxyuridine. Br Inst Radiology Report 1989; IV: 113–19.
- Terry NH, White RA, Meisterich ML, Collins DP. Evaluation of flow cytometric methods for determining population potential doubling times using cultured cells. Cytometry 1991; 12: 234–41.
- Rew DA, Wilson GD. Advances in cell kinetics: A leading article. BMJ 1991; 303: 532–3.
- Rew DA. Heterogeneity, biodiversity and bioperversity in solid neoplasms. Eur J Surg Oncol 1996; 22: 469–73.
- Bennett MH, Wilson GD, Deche S, Saunders MJ, Martindale CA, Robinson BM, O’Halloran AE, Leslie MD, Laing JHE. Tumour proliferation assessed by combined histological and flow cytometric analysis: implications for therapy in squamous cell carcinoma in the head and neck. Br J Cancer 1992; 65: 870–8.
- Rew DA. Cell proliferation, tumour growth and clinical outcome: gains and losses in intestinal cancer. Ann Roy Coll Surg Engl 1993; 75: 397–404.
- Wilson GD. Limitations of the BUdR technique for measurement of tumour proliferation. In: Beck-Bornholdt HP (ed.) Current Topics in Clinical Radiobiology of Tumours: Medical Radiology Series; Springer-Verlag, 1993.
- Haustermans K, Hofland LJ, Pottie G, Ramaekers M, Begg AC. Can measurements of potential doubling time (Tpot) be compared between laboratories? A quality control study. Cytometry 1995; 19: 154–63.
- Williamson KE, Gilliland R, Weir H, Grimes J, Hamilton P, Anderson N, Crockard A, Rowlands N. Hydrochloric acid denaturation of colorectal tumour tissue infiltrated with bromodeoxyuridine. Cytometry 1994; 15: 162–8.
- Gilliland R, Williamson KE, Hamilton P, Crockard A, Spence RA. DNA denaturation sensitivity may invalidate bromodeoxy-uridine-DNA flow cytometric analysis of the potential doubling time in colorectal tumours. Br J Surg 1997; 84: 242–7.
- Shibui S, Hoshino T, Vanderlaan M, Gray JW. Double labelling with iodo- and bromodeoxyuridine for cell kinetics studies. J Histochem Cytochem 1989; 37: 1007–11.
